Jan 15, 2024
Larry Berman: Higher risks in first half of 2024?
By Larry Berman
Expect Biden-Trump rematch in 2024 U.S. election: Charles Myers
VIDEO SIGN OUT
In over 37 years of actively following markets, we have learned that timing them is hard.
Seasonal patterns can help tilt investor expectations, but we have yet to find an indicator or series of indicators that gets it right all the time. If we ever do, you will not know about it – why would we tell if we figured out the secret to market timing?
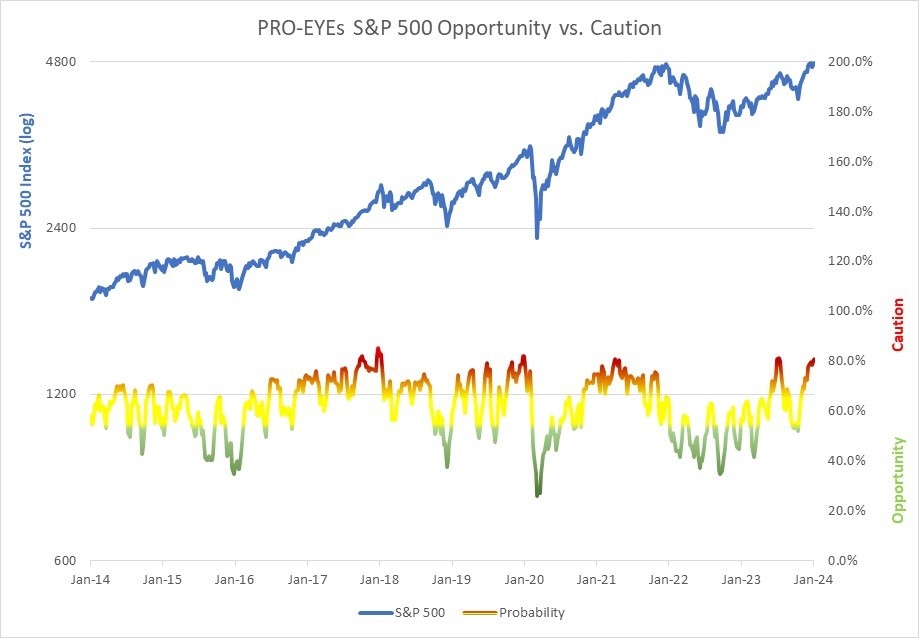
Until we get there, we’ve developed the Berman’s Call PRO-EYEs indicators to help navigate some of the risks. It was designed to improve on the benefits of the CNN Fear and Greed Index for understanding extreme periods. We are currently in a “high caution” environment in the PRO-EYEs compared to the “Greed” range in CNN’s version.
MEASURING THE MARKET
There are three factors we consider key to measuring the market environment with these types of composite indicators:
- Valuation
- Business cycle (growth and inflation)
- Tactical (trading sentiment)
CNN’s index does not consider the first two factors, but looks at several aspects of the tactical sentiment side. So in theory, we have a broader based indicator.
There are 20 factors we measure each week: four valuation factors, four business cycle factors and twelve technical factors. Two of the 12 technical factors are based on seasonal influences.
Currently, the overall index is suggesting a high degree of caution. Historically, when the index is at these levels, the one- and three-month forward-based returns are negative a high percentage of the time, by an average of seven per cent.
U.S. PRESIDENTIAL YEAR
The one factor we are taking a deeper dive on today is the U.S. presidential election year seasonal pattern. We think politics and geopolitics will matter much more going forward. Political leaders direct policy, taxes (revenues) and deficits (expenses).
The fiscal outlook for the U.S. is dire. I don’t see a way out of the massive unfunded liabilities (entitlements) unless we have complete political reform, including term limits and much more fiscal responsibility. In short, good luck with that. So investors need to understand what the increasing debt-to-GDP ratios mean for growth and inflation.
Quantitative easing (debt monetization) was created to help deal with financial liquidity since the great financial crisis in 2008-09, and will likely continue to be a major policy tool. The U.S. Federal Open Market Committee (FOMC) is now talking about what level of balance sheet is needed. We will hear more about it at the Jan. 31 meeting. We expect the FOMC will shrink the balance sheet about US$1.5-2.0 trillion more over the next few years. This number comes from something the FOMC said a few years ago about the right size being 10 to 11 per cent of GDP, of the SOMA (System Open Market Account) portfolio.
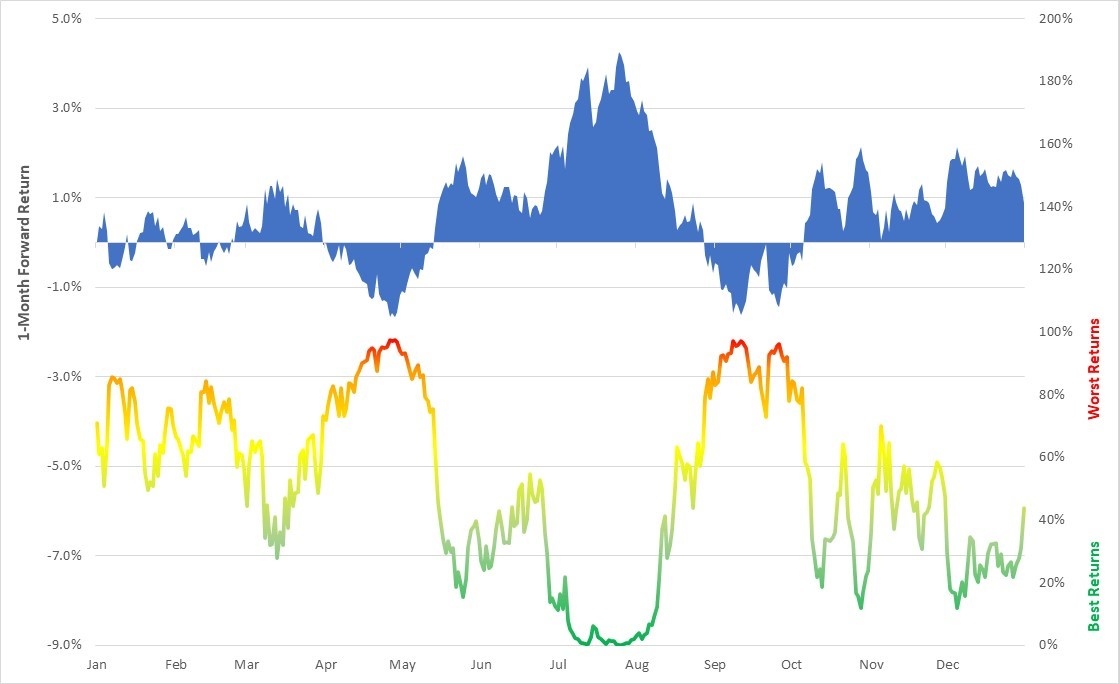
The seasonal pattern tends to be weak in the first half of an election year, as can be seen in the blue line.
The chart shows average one-month forward returns of the S&P 500 since 1927. Bullish seasonal patterns tend to be very positive from May to August and again following the election. The need to fund quantitative tightening and the massive deficit means the U.S. Treasury is estimated to need to issue more than $2 trillion in new bills, notes, and bonds this fiscal year.
Last quarter (Nov. 1, 2023, the same day as FOMC pivot), U.S. Treasury Secretary Janet Yellen chose to issue more bills to reduce the massive liquidity in the repo market. Most of that liquidity has been removed. When she chose to issue more notes and bonds in the previous quarter (Aug. 2, 2023), it put significant upward pressure on longer rate (100 basis points) from August to October. Risk is high that the Treasury will issue more coupon bonds in the coming quarters. It fits with the seasonal patterns for weaker equity markets and with longer-term bond yields coming down. The cost to the taxpayer is much better than it was when yields were above five per cent in October.
Treasury has a mandate to keep the cost of the debt as low as it can for the benefit of the taxpayer. This should allow Yellen to issue more long-term debt that will likely pressure assets now and issue more bills later in the year, so that heading into the election, financial conditions are easy again.
One thing is for sure, they need to raise a record amount of debt, and the FOMC is no longer buying it. For the most part, neither is Japan or China.
Thanks to Andy Constan and his team at Damped Spring Advisors for his help with the Treasury flow analysis and impact on asset markets.
Follow Larry:
YouTube: LarryBermanOfficial
Twitter: @LarryBermanETF
Facebook: @LarryBermanETF
LinkedIn: LarryBerman
www.etfcm.com


