Dec 18, 2023
Larry Berman's market forecasts for 2024
By Larry Berman
Larry Berman's Educational Segment
VIDEO SIGN OUT
The Street forecast for next year is fluid. I think we can tilt it higher by 100 points or about two per cent from where we are now, following the U.S. Federal Open Market Committee (FOMC) validation last week that a Goldilocks outcome is likely. We also heard a few FOMC members try to walk back the market’s enthusiasm, pricing in six rate cuts next year as soon as March. That is way, way too early, in my opinion, unless we get a hard landing.
The top-down strategists are currently around 4,800 as the average target for the end of next year. This speaks to how much good news is already priced in. The bullish strategists are at 5,100 to 5,200 while the bears are in the 4,200 to 4,600 range. Looks like a pretty dull year with low volatility. The bears see zero earnings-per-share (EPS) growth and the bulls see more than 10 per cent EPS growth. In all cases, the multiples are in the range of 19 to 21 times.
From the bottom up, if you take the 12-month price target on every stock and weight it by the index, you get about 5,100. Keep in mind this is every stock hitting its price target at the same time, which is not practically possible. Historically, when the market gets within 10 per cent of that number, it’s fully valued. We are already there now.
From top-down and bottom-up perspectives, there is not much juice left to squeeze. I’m going with the under in terms of year-end target for both EPS and level. If the economy is going to be as strong at six per cent EPS growth would suggest, then the FOMC will not be cutting rates at all, in my view. If we get a hard landing, EPS falls 10 per cent or more and the multiple is closer to 16-times or less and not 20-times. To say the market is close to fully valued is an understatement. Don’t shoot the messenger.
We think odds of a recession are still extremely high. Historically, the inversion in the curve matters. The current rebalancing of the world’s supply chains is inflationary and the demographic trends for at least the next decade suggests labour markets should remain tight. To us, this means a higher-for-longer fight against inflation and a higher base rate. This time around, we are not seeing an impact on housing costs from higher rates for U.S. consumers and we are still at full employment. This will likely keep wage up pressures (read: sticky core inflation). It also suggests that the nominal economy will remain stronger than expected. That is good for markets and good for earnings, so a collapse in stocks is not likely.
The risk of the U.S. Federal Reserve cutting too much and igniting inflation again is way higher than the market is pricing in. We look back to the double dip recession in the early 1980s as a risk in the coming years. The FOMC believes they have likely done the job in terms of bringing inflation back down. We think they err on the side of delaying rate cuts.
The U.S. 10-year yield can rally to 3.5 per cent technically. But if inflation is going to be sticky, we do not see it getting lower unless there is a hard landing, so either stocks or bonds are grossly mispriced. That said, the deficit and quantitative tightening supply for the next year or two is likely going to limit the bond rally in the best case, and in the worst case, we see yields potentially push back towards five per cent. If you can correctly forecast inflation levels, then you have a better chance at predicting asset values.
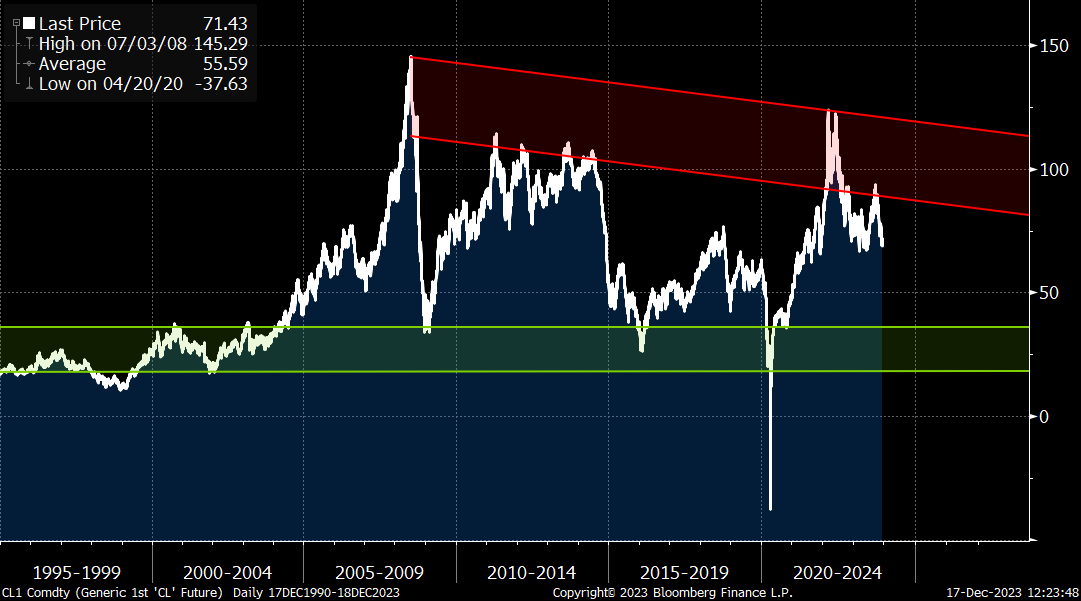
The cost of energy is a big part of inflation trends. Here’s where we think the long run trend is positive from an inflation standpoint, but we expect to see high inflation due to the clean energy shift that will not stop despite the recent weakness in the sector. In the short run, the U.S. Strategic Petroleum Reserve replenishment should put a floor under WTI in the US$65 to 70 range. If a recession is coming, we will likely see a move back below US$50.
And finally, gold is showing a structural longer-term bullish structure.
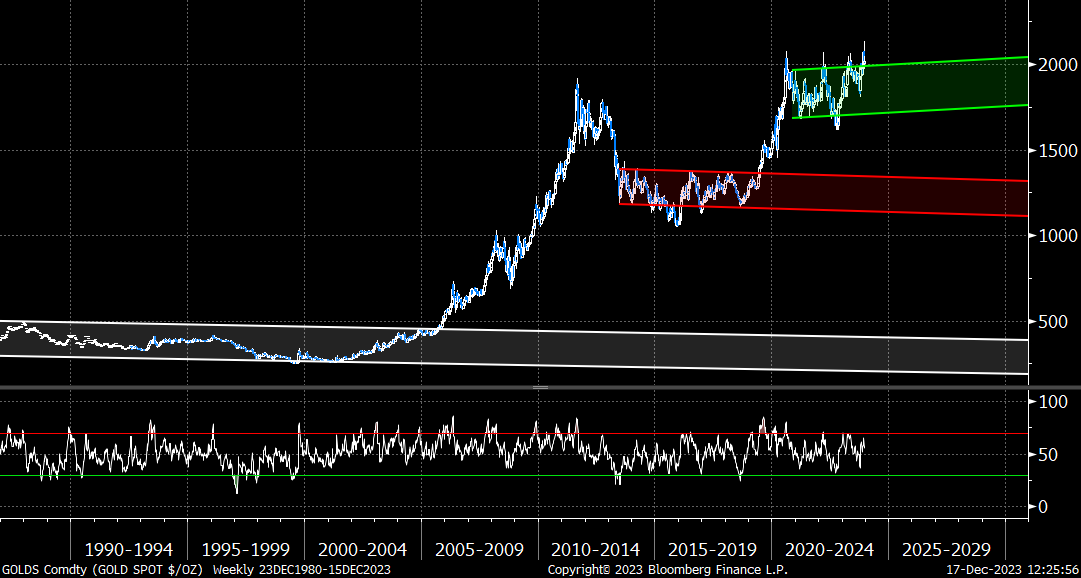
I suspect we have another few years or more of sideways base-building in the 1,800 to 2,100 range not unlike what we have seen historically. The next breakout is a move to negative real yields. We do not see that as likely until inflation is under control. Buy dips, trade the range with a longer-term bullish bias, but a sustainable breakout is less likely.
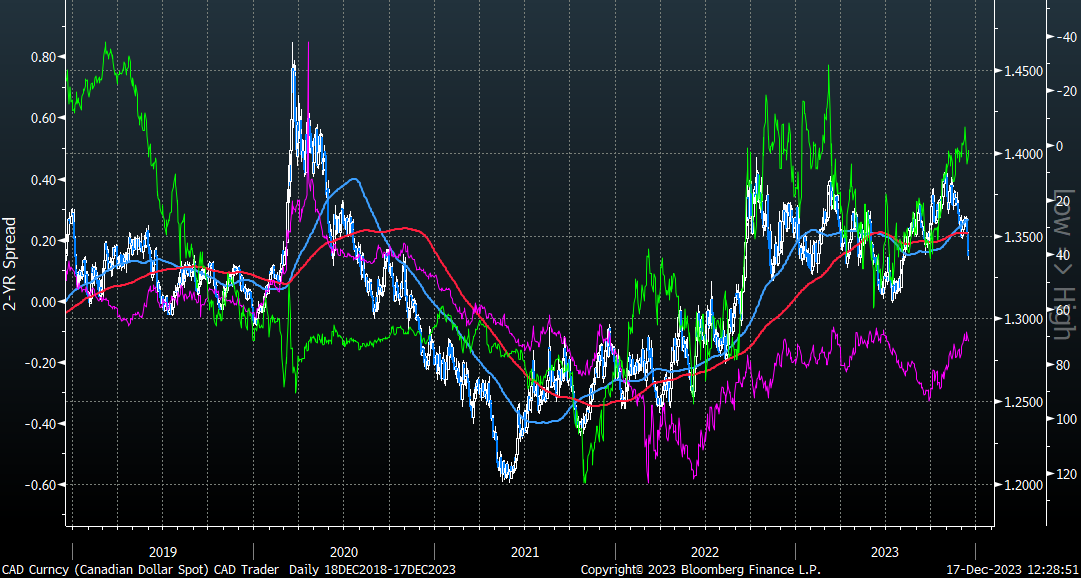
For the Canadian dollar, a sideways range seems most likely in 2024, similar to 2023.
We expect Canadian bond yields to be lower than in the U.S. and for crude oil not to trend strongly in either direction. The risk to the Canadian dollar is weaker not stronger, so having more U.S. dollar exposure near 1.32 makes sense.
Happy Holidays, Merry Christmas and the best of health and happiness in the New Year. See you all again in 2024.
Follow Larry:
YouTube: LarryBermanOfficial
Twitter: @LarryBermanETF
Facebook: @LarryBermanETF
LinkedIn: LarryBerman
www.etfcm.com