Oct 3, 2022
Larry Berman; PRO-EYEs tactical indicators most oversold since GFC. Get ready for another bounce
By Larry Berman
Larry Berman's Educational Segment
VIDEO SIGN OUT
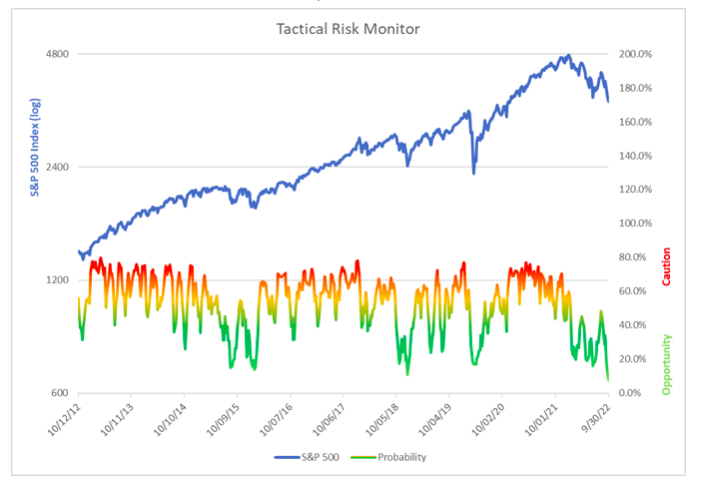
The PRO-EYEs indicator was made available online for BNN Bloomberg viewers to get a lens into my macro view of markets. The tactical component is made up of 12 well-known technical indicators of trend, sentiment, breadth and seasonality. All may have heard of the CNN Fear and Greed index. PRO-EYEs is a more robust indicator and was designed with a similar philosophy. It attempts to identify periods of extreme market behaviour and periods of caution and opportunity. Currently, the composite tactical factor is at extreme opportunity levels not seen since the 2008-2009 financial crisis. The indicator hit these levels the week of Oct 3. 2008 when the S&P 500 closed at 1,099 points. The extreme low weekly close was 899 two weeks later and the bear market low was the week of March 6. 2009 at 683, but the indicator was not as extreme. It was the shock of the Lehman moment on September 15., 2008 that the market was not ready for.
| Factor | Z-Score | Risk Level |
|---|---|---|
| 5-day put/call ratio | -1.98 | 2% |
| Speculative position S&P 500 futures | -1.51 | 7% |
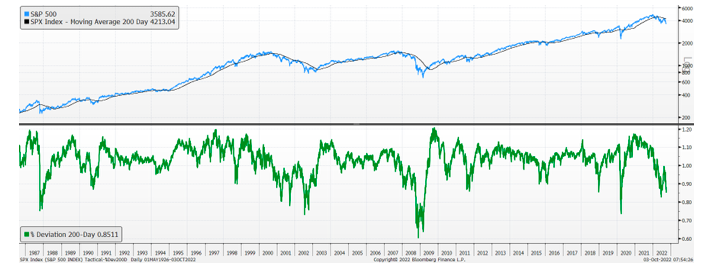
| Percentage deviation from 200-day moving average | -3.20 | 0% |
| AAII bull vs. Bear sentiment spread | -2.55 | 1% |
| Seasonal pattern (all years) since 1928 | -0.01 | 50% |
| Presidential cycle (current year) since 1928 | -1.29 | 10% |
| Current vs average volatility (VIX) | -1.31 | 9% |
| Current vs future volatility (VIX) | -1.28 | 10% |
| Percentage of S&P 500 holdings above 50-day average | -2.81 | 0% |
| Percentage of S&P 500 holdings above 200-day average | -2.90 | 0% |
| Breadth-McClellan summation index | -2.74 | 0& |
| Overbought-oversold 13-week relative strength index | -2.20 | 1% |
| Total tactical factor: | -1.98 | 8% |
The Z-score is the number of standard deviations the indicator has deviated from the lifetime mean of the indicator. We are currently seeing price at -3.2 standard deviations below the 200-day average. That means this observation occurs one in 1455, (or about one in six years). The overall average Z-score is -1.98, which is lower than seen at the depths of COVID. The one factor that is not near extreme levels is the seasonal pattern for all years, which is still neutral given October historically can be volatile. The three breadth readings are very extreme, while volatility is still well off other very acute periods of panic.
Laying out a roadmap like this helps with making decisions around asset allocation. Every week BNN Bloomberg callers ask about if it’s time to buy. The index says there is a lot more opportunity buying now versus late last year. But that was true last week too, and the market overall fell again last week. With indicators like this, it helps to recognize the environment, but it is not a guarantee. Gauging the market’s temperature is a moment in time measurement. My sense is that we are not at the bottom just yet, but there should be a tradable rally in front of us.
We begin the Fall 2022 virtual roadshow on YouTube and GoToWebinar. Sign up at https://investorsguidetothriving.com. We will start the series with talk about some of the lessons I’ve learn over the past 35 years making good and bad investment decisions. As always, our educational efforts on BNN Bloomberg support charity. Over the past decade, we have raised over $500,000 for brain health, dementia, and Alzheimer’s research at the Baycrest Hospital. You can add your donation here. I match all BNN Bloomberg viewer donations up to $25,000. Please help out with an assist.
Follow Larry online:
Twitter: @LarryBermanETF
YouTube: Larry Berman Official
LinkedIn Group: ETF Capital Management
Facebook: ETF Capital Management
Web: www.etfcm.com


