Jun 16, 2022
How the 2022 bear market is different from the last one
, Bloomberg News
We may see some weakness in Q2 earnings: Portfolio manager Colin Stewart
VIDEO SIGN OUT
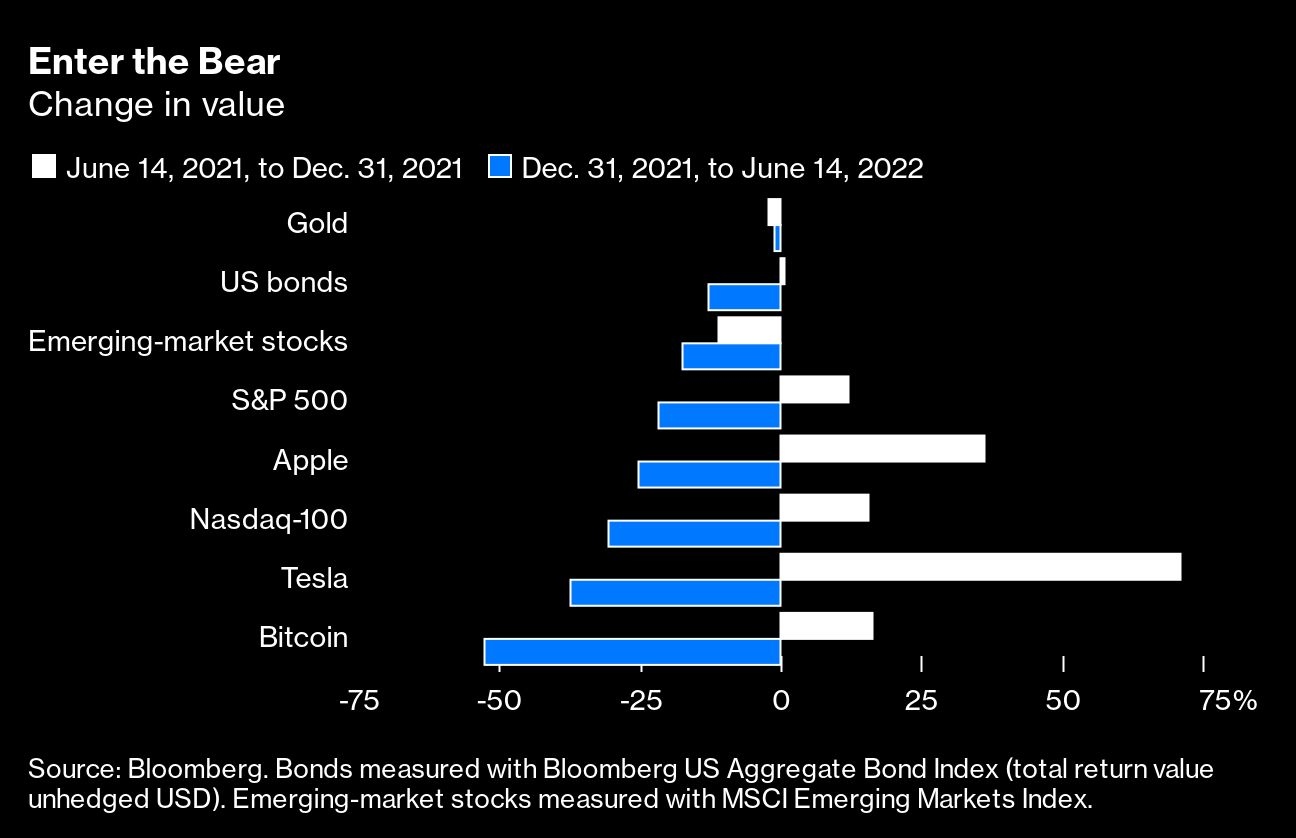
It’s time to navigate through what traders call a “sea of red,” the color used to signal declines in asset prices on their computer screens. Almost everywhere you look right now, it’s crimson.
The S&P 500 has fallen more than 20 per cent from its high on Jan. 3, and the Nasdaq-100 has plunged 30 per cent from its November record. Bitcoin has lost two-thirds of its value since it almost touched US$70,000 per token seven months ago. Even a conservative investor, with a sober mix of 60 per cent in stocks and 40 per cent in bonds, is down about 17 per cent this year. And US government bonds, long considered the safest harbor, have lost investors almost 12 per cent in 2022, according to a Bloomberg index of US Treasuries that’s having its worst year ever.
Do yourself a favor and don’t mentally adjust those returns for inflation, which is the one thing that’s up: The US consumer price index is 8.6 per cent higher than it was a year ago.
We’ve been here before, not so long ago, when the shock of COVID-19 knocked equities down by more than 30 per cent in 2020. But that brief episode was quickly wiped away once investors figured out that policymakers from the Federal Reserve and Congress were on their side, and that they could continue betting on easy credit conditions and more growth. The S&P 500 peaked on Feb. 19 that year and hit its low barely a month later, on March 23; the index was back to record highs by the middle of August.
This time feels different. Assets are going red because traders are letting go of a lot of the thinking and habits they’ve relied on over the years, and it’s hard to say where that adjustment will end. For one thing, investors are losing the reflex to “buy the dip,” which was learned in the decade following the global financial crisis of 2008, when no downturn in the market lasted very long or, until the pandemic, cut very deep. This decline is already more than five months old.
Traders have also drastically updated their thinking about the Fed. They’d long been confident the central bank would always come to their rescue by lowering interest rates or canceling plans to raise them should stocks decline too much. That’s not happening now—Fed Chair Jerome Powell seems determined to keep pushing up rates, and on June 15 announced a three-quarter-point hike. The central bank has changed its mind about some things, too. After struggling for years to lift inflation to 2 per cent and then figuring last year’s pickup was “transitory,” policymakers have been surprised by the continued rise in prices and are signaling they’ll combat it more urgently.
Rising rates are pushing down bond prices, but for stock investors what’s really scary is the idea that Powell, long seen as an inflation dove, may in fact be getting ready to follow the model of Fed Chair Paul Volcker. Faced with even worse inflation in the late 1970s and early ’80s, Volcker kept raising rates until he triggered a recession. While many on Wall Street still hold out hope that Powell will engineer a softer landing, no one’s sure if he can.
There are still some things Wall Street hasn’t fully changed its mind about—at least not yet. Managers of active mutual funds can’t quite seem to part with technology and other companies with high expected rates of growth, regardless of how poorly those stocks have performed this year. Active funds have maintained a bias toward most growth and tech stocks in the S&P 500, according to Bank of America equity and quant strategist Savita Subramanian. “Behaviorally, it’s hard to shed the sector that made us the most money in the last cycle, particularly when it is demonstrably lagging,” she wrote in a note to clients. Perhaps that effect will provide some support for those stocks—or maybe it means there’s one more cherished belief that will have to fall before the market hits bottom.
Now that the S&P 500 has entered a bear market by closing more than 20 per cent below its last record high, investors are dusting off history books that have gone unused for a long time. How long could this bear linger, and how bad could the losses get? Once it enters a bear market, the S&P 500 on average has fallen an additional 14 per cent and taken 103 more days to find a bottom, according to Chris Murphy, Susquehanna Financial Group’s co-head of derivatives strategy, who examined 12 previous episodes since 1945. In theory, that means it could be until early November before this red sea finally parts.
Of course, historical comparisons should always be taken with a grain of salt—perhaps several grains this time around, considering how unusual the economic and market fundamentals are in the COVID era. Cryptocurrencies are still so new that it’s next to impossible to take much from their history. And with little backing them up besides the faith of other crypto traders, they’re even more subject to shifts in mood. It wasn’t so long ago, after all, that the standard case for crypto was that it could be a hedge against inflation or falling prices in traditional assets. Now it’s looking like just another speculative bet that works when investors have a taste for risk—and goes deep, dark scarlet when they don’t.


